online since 2009
Gauge Chart for Fundraising
Visualize your campaign progress with an embeddable gauge chart. Choose from a segmented arc or chrome dial — both embed on any website with one snippet.
2 gauge chart styles
Both are Pro styles — unlock with a $49/year license key.
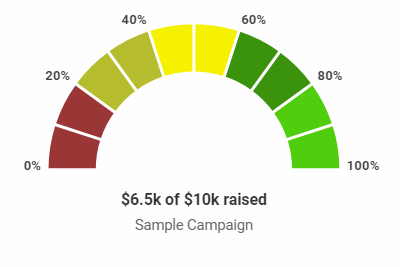
Gauge
segmented arc, half-circle speedometer
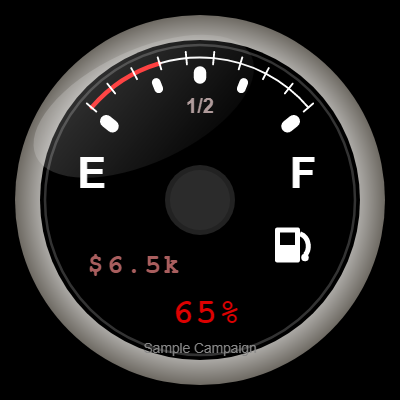
Chrome Dial
circular dial with chrome bezel
When to use a gauge chart
Gauge charts work best when you want a modern, dashboard-style look.
Corporate campaigns
Employee giving programs and corporate charity drives benefit from the clean, professional gauge aesthetic.
Sales & revenue goals
Track a sales target or revenue milestone with a speedometer-style chart that reads instantly at a glance.
Event fundraising
Display on a screen during a live event — the gauge needle moving as donations roll in creates immediate excitement.
Dashboard embeds
Gauge charts fit naturally into any data dashboard or reporting page where thermometers would look out of place.
How to embed a gauge chart
1
Create your chart
Enter your goal and current amount, then select the Gauge or Chrome Dial style in the style picker.
2
Enter your Pro key
Gauge styles are Pro-only. Enter your license key on the create form or activate it on your account page.
3
Paste and go live
Copy the one-line
<img> snippet and paste it into any page. No JavaScript needed on your site.Frequently asked questions
What is a gauge chart?
A gauge chart (also called a speedometer chart or dial chart) shows a single value on a circular or semi-circular scale. For fundraising, it indicates how far along a campaign is toward its goal — like a speedometer needle moving toward 100%. It's a modern alternative to the classic thermometer for campaigns that want a sleeker, dashboard-style look.
How is a gauge chart different from a thermometer?
Both show progress toward a goal, but in different visual formats. A thermometer is vertical, with a rising liquid column — intuitive and widely recognized for fundraising. A gauge is circular or semi-circular, like a speedometer — it reads as more "technical" and fits well in dashboards or alongside other data. Both embed the same way: one
<img> tag.Does the gauge chart support Google Sheets live sync?
Gauge styles do not currently support Google Sheets live sync. For campaigns that need automatic updates, thermometer styles 0–15 support Sheets sync. Gauge charts are best for campaigns updated manually.
Is the gauge chart free?
Gauge styles are Pro-only. Pro costs $49/year and includes all 18 chart styles, no watermark, custom colors, and Google Sheets live sync for compatible chart types. The Original thermometer (style 0) is always free.
Create a gauge chart for your campaign
Pro from $49/year — cancel anytime.
Get started →